The AI analyst for commercial real estate
Will this site cannibalize the one down the street, or is a market underserved? Ask in plain English and watch GrowthFactor run the analysis.
Used by restaurants, retailers, brokers, and franchise operators across the U.S.

Books-A-Million
“GrowthFactor accelerated our team’s new store site selection process, allowing the team to expedite the review of hundreds of potential sites as part of a complex bankruptcy auction.”

Matthew Furnas
Vice President
TNT Fireworks
“Our business is very seasonal, and we have to manage evaluating hundreds of locations in a short time frame, while picking the best ones. GrowthFactor makes doing that simple.”

Carson Anderson
Managing Director
Lil Sweet Treat
“What could take three weeks to pull, we could do in two days. We can pull a presentation or an overview much, much quicker — and compare sites side by side as we think about where to prioritize our growth.”
Jack Ross
Founder
Cavender’s Western Wear
“With GrowthFactor we've been able to expand much faster, make quicker decisions, we don't have to dig.”

Mike Cavender
Co-Owner and Head of Real Estate
The analyst legwork, without the black box
Most “AI” in real estate is a chat window bolted onto a guess: confident, fast, impossible to defend when committee asks where the number came from. GrowthFactor is the opposite — it runs on the same machine-learning models and market data as the platform, and shows every step. It does the analysis. You make the call.
Meet GrowthFactorPlan a whole market in one conversation
Early AccessAsk GrowthFactor to work a whole market, not just an address. It reads trade areas, co-tenancy, and demographics across the metro, then ranks the candidates with the math behind each call.
Ask it anything about your deals
See it work a pipelineRank a pipeline stage, then ask why — one conversation, no spreadsheet.

Demand is ideal — $66.5k median income, zero cannibalization — but the site sits inside Florida Mall, and your brand avoids enclosed-mall formats. That caps visibility and access.
The first MCP in commercial real estate
See the MCPStill the only one. Connect the AI tools you already use — Claude, ChatGPT, Cursor, VS Code — and your agent works GrowthFactor's aggregated data and ML models directly: the real scoring engine and your portfolio model, not a prompt you could write yourself.
Ask GrowthFactor, then decide how deep to go
GrowthFactor gives one defensible answer two ways: most teams start with the Platform, and Labs plugs in when the stakes get higher. They're built to stack.
GrowthFactor Platform
A dozen fragmented data sources, one screen. The quick qualifying read up front; the fine detail one click behind it. The whole team on one license.
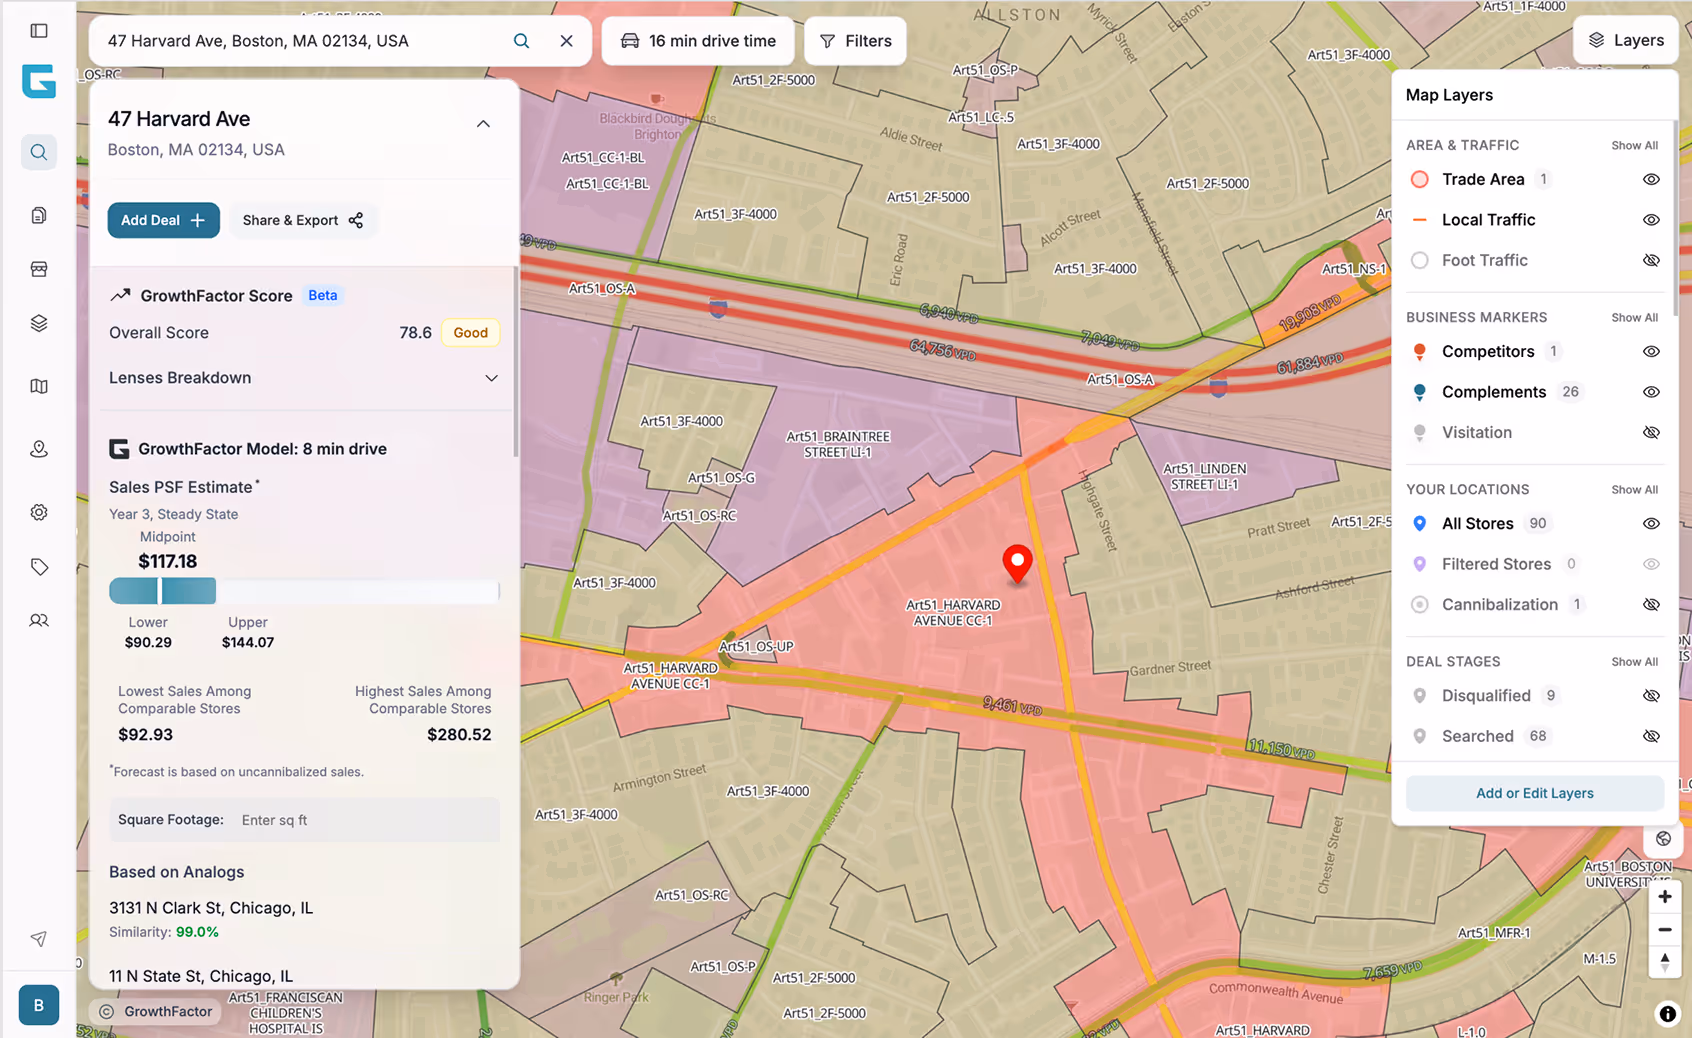
Single-site analysis. Search an address: layers, demographics, analogs, cannibalization — a committee-ready first draft in under 10 seconds.
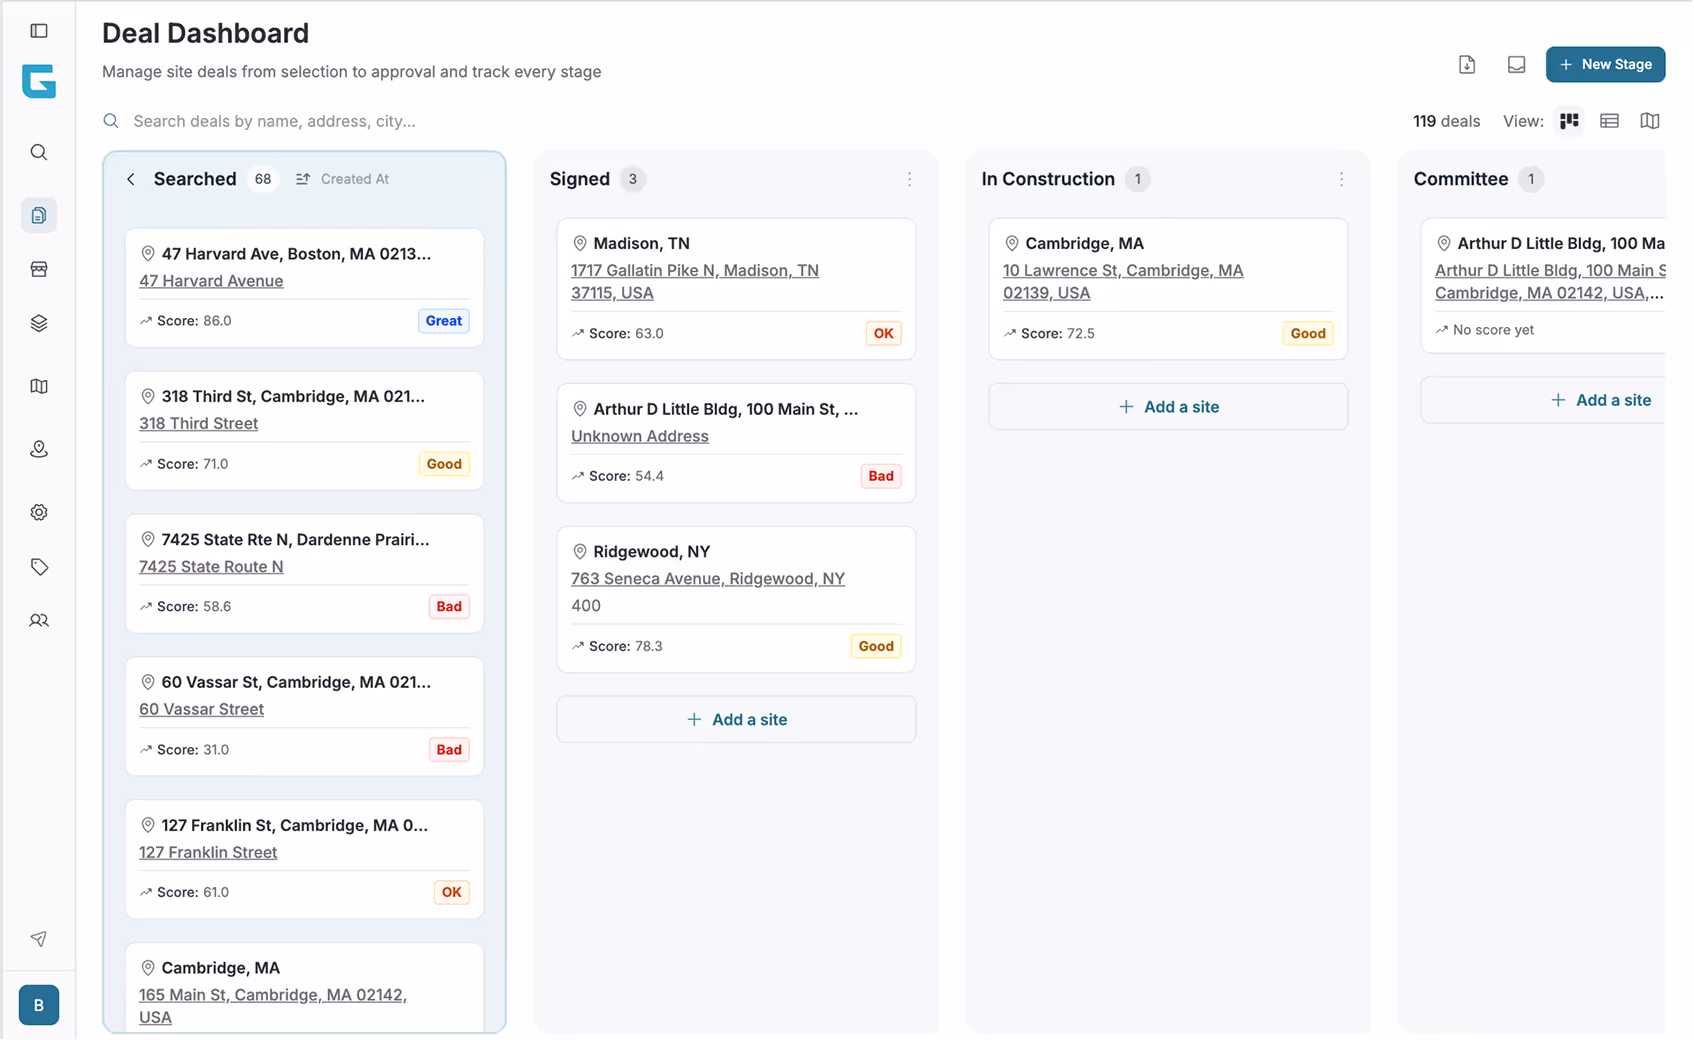
Deal Dashboard. Searched sites become tracked deals. Broker details, LOIs, every analysis saved — stages your team defines.
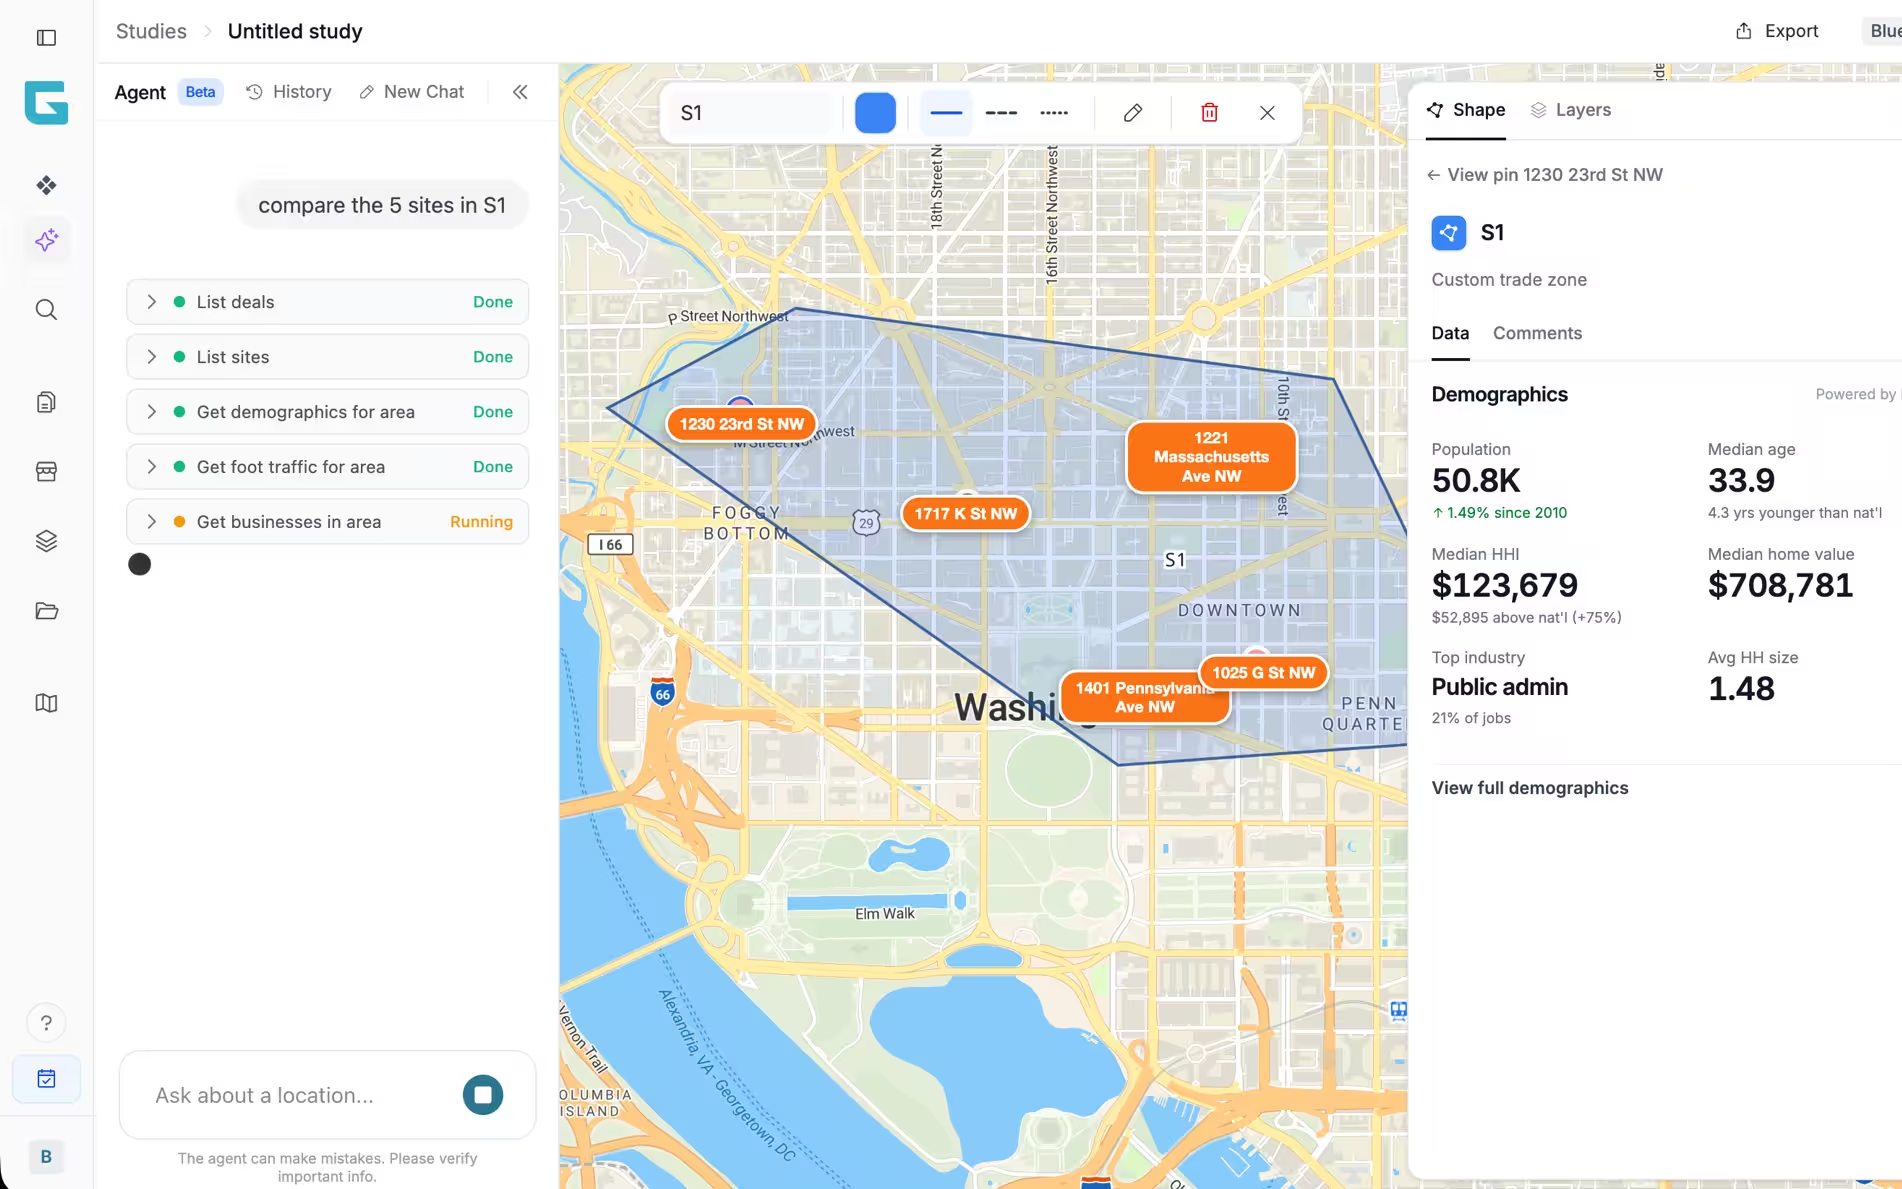
Market Planning. Draw a trade area and GrowthFactor plans the market: scoring, forecasts, cannibalization.
GrowthFactor Labs
Custom revenue forecasting built on your own sales data — with a dedicated data scientist who builds the model with you and knows your markets.
Custom forecast models. Your stores, geocoded and enriched — demographics, traffic, co-tenancy — then distilled to the few variables that actually drive revenue.
Your data science team. The data scientist who built your model runs it live, takes feedback, and retunes until your team trusts it.
Discovery. 30 days, $5,000. Map your existing performance before you commit.
One workflow from first look to signed lease
Was the way you evaluate deals designed, or did it just accumulate? Most teams run on a rag-tag stack of scoring spreadsheets, deal trackers, and screenshots in a deck. GrowthFactor puts pipeline, analysis, and history in one place — kanban, table, and map on the same deals.
“This is it. This is it for me. Nobody else has it. Nobody else has done anything close to it.”

- demographics$94k median HHI+
- foot traffic2.1M annual+
- competition3 within 2 mi−
- visibilitycorner, 38k VPD+
- market potentialweighted 64%+your weight
Every score traces back to something you can explain
Most tools hand you a score and hide the math. Here, every input traces back to its source and every weight is yours to adjust — and when Labs builds your model, you get the data scientist who built it and knows your markets.
See how the scoring worksYour art.
Our science.
Trade areas drawn live, the way the model reads the land — by radius, drive time, walk time, or where your customers actually come from. You read the market. We show the work.
Forecasts built on your portfolio
Send us your sales history and we build a forecast on what actually drives your revenue — then prove it against markets you already know before it scores one you don't. A dedicated GrowthFactor data scientist builds the model with you and retunes it until your team trusts it.
Calibrated to how your business actually works
Default models carry someone else's portfolio in the math. We start with your sales history and don't sign off until the model explains a store you've run for ten years.

“Other services hide behind black-box models that are hard to trust. The beauty of GrowthFactor is they make site selection incredibly simple, and give us clear unbiased recommendations.”
The model gets sharper every time you use it
When a store opens, actual performance feeds back; the next forecast for a similar market is sharper. Nothing walks out the door when someone leaves.
See how the model learns“Not only did we open more stores, but they're outperforming our existing stores.”

What changes when every question gets answered fast
All customer storiesSee for yourself
Whether you run it yourself or bring in a team at the table, we built both.
30 minutes on one of your markets.
- Built on your data, tuned to your portfolio
- See the reasoning behind every score
- Layers onto the tools you already use